

Executive summary of the AFPDB Best Practices Guidelines:
- The present Guidelines aim at proposing best practices and recommendations for Value for Money framework at the attention of manufacturers of Structured Products (“SPs”)
- The VfM framework is part of an ecosystem of existing rules and guidelines governing the promotion, sale and accompaniment during the life of financial instruments, designed to protect end-investors and act in their best interests (PG, costs & charges, suitability, precontractual information).
- The AFPBD VfM framework for SPs is a proportionate approach that ensure screening of products on (i) probabilistic benchmarking to verify expected performance given embedded costs and (ii) qualitative assessment of products value/benefits and services provided. It could add an optional quantitative filtering for proportionality purposes, e.g., based on a cost grid filter.
- Ultimately, this screening ensures that products launched bring value for end-investor.
- The AFPBD VfM framework should be transparent towards supervisors / regulators.
- Appropriate information on VfM should be communicated to distributors.
Updated version : 31 July 2025
VALUE FOR MONEY FOR STRUCTURED PRODUCTS
–
AFPDB Best Practices Guidelines
AFPDB
The French Structured Investment Products Association (Association française des produits d’investissement de détail et de bourse – “AFPDB”) is the industry association representing issuers and manufacturers of structured products and securitized derivatives in France. The AFPDB purpose is to contribute to the development and promotion of structured products on the French and European markets by defining industry best practices and by maintaining an open and constant communication with policy makers, supervisory authorities, market participants, market operators, technology and service providers. afpdb.org
Disclaimer
Present Guidelines are only recommendations and not mandatory nor binding. Objective is to favor as much as homogeneity and consistency among members for designing Value for Money framework to ensure level playing field, but each firm remain responsible to adjust, follow or not each of those recommendations. These Guidelines will evolve in time considering, notably, relevant regulatory change.
1. Regulatory context, objectives and scope of VfM
a. Context
In the context of the development of the Retail Investment Strategy (“RIS”), European Commission’s priorities are to ensure “adequate protection, bias-free advice, open markets and transparent, comparable and understandable product information”1.
Those past years, many European initiatives (MiFID II, PRIIPS, etc.) have been implemented to enhance retail investor protection and to improve the quality and the pricing of financial instruments and investment services in the EU. At national level, National Competent Authority have been taking initiatives in the matter. For instance, in France, insurers are subject to ACPR 2023-R-01 recommendation which recommend testing that costs of products referenced in insurance wrappers are proportionate to the benefits of the product2.
Indeed, assessment of value of products derives naturally from the regulatory framework (MiFID II delegated directive and ESMA Q&A).
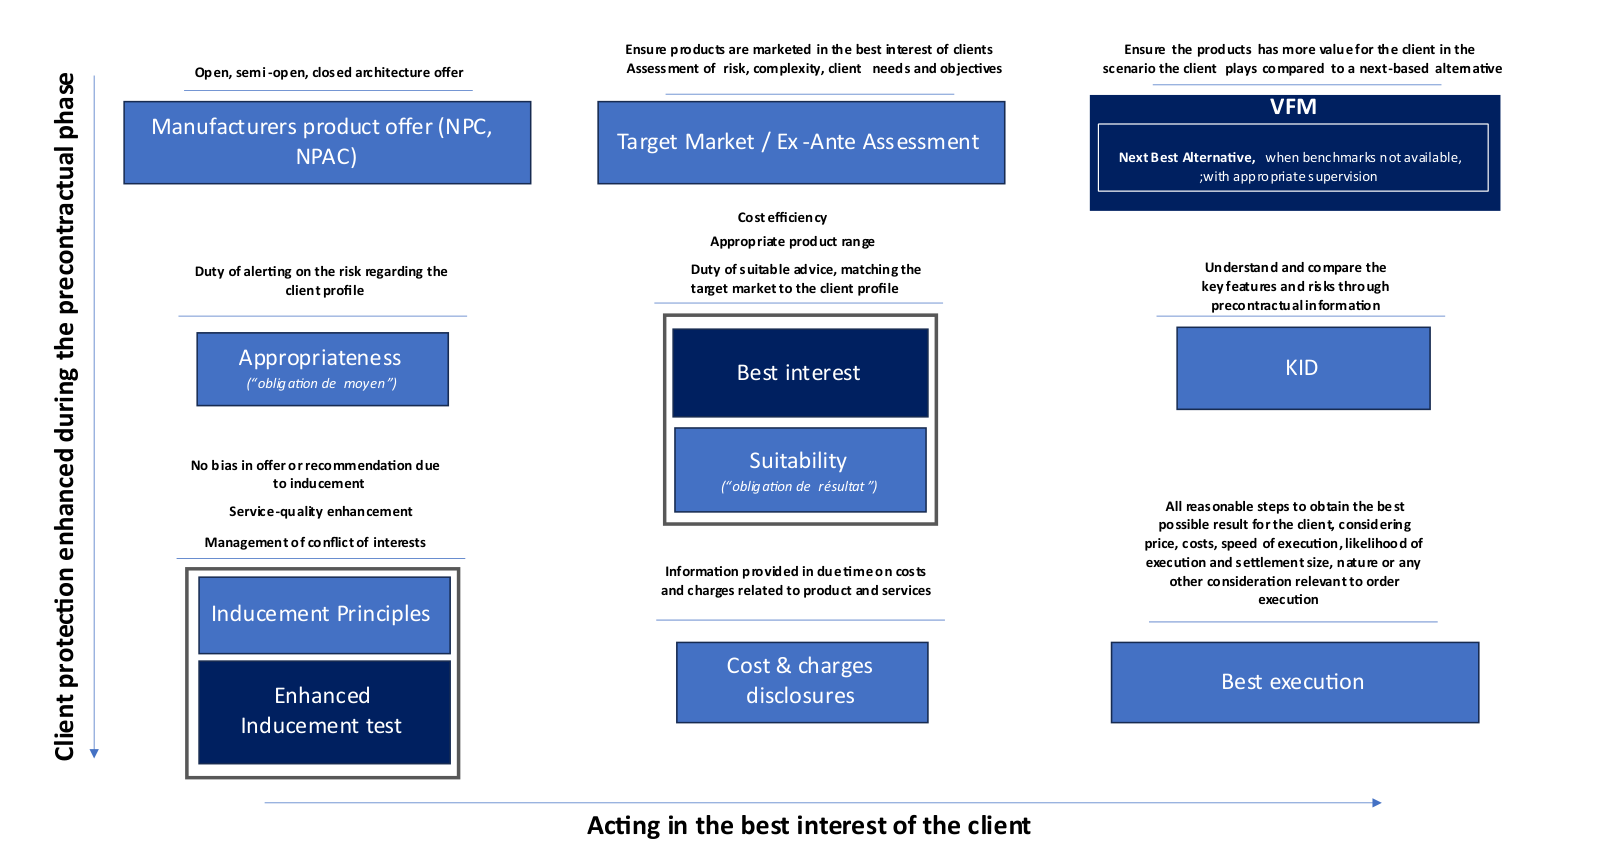
As such, we see the assessment of the VFM of a financial product as an integral part of the Product Governance, that itself is a part of a broader and strong regulatory framework protecting investors, such as the costs & charges transparency and other precontractual information (KID), the suitability process, the best execution, aiming at protecting the investor and acting in its best interest, further enhanced by the RIS reform and as demonstrated in the figure in annex I. For the avoidance of doubt, these guidelines are intended to supplement but not to replace existing internal margin policies of both manufacturers and distributors.
In this context, the present Guidelines aim at proposing best practices and recommendations for assessment of value, also called “value for money” of structured products (“SPs”) to be performed by the manufacturer/issuer [here after “VfM”].
Value provided to end retail investors is the result of several steps in the value-chain that encompasses each step of the manufacturing and distribution of financial products.
This Guidance focuses on the manufacturing level of VfM.
At this stage, such Guidelines are dedicated to the French market and limited to products in scope as determine below in c).
b. Objectives of VfM
A successful VfM framework should take into consideration the following points:
- Product Governance framework/Cooperation between Manufacturers and distributors. VfM is an integral part of the Product Governance set-up and as such involves a necessary cooperation between manufacturers and distributors but avoids unnecessary duplication.
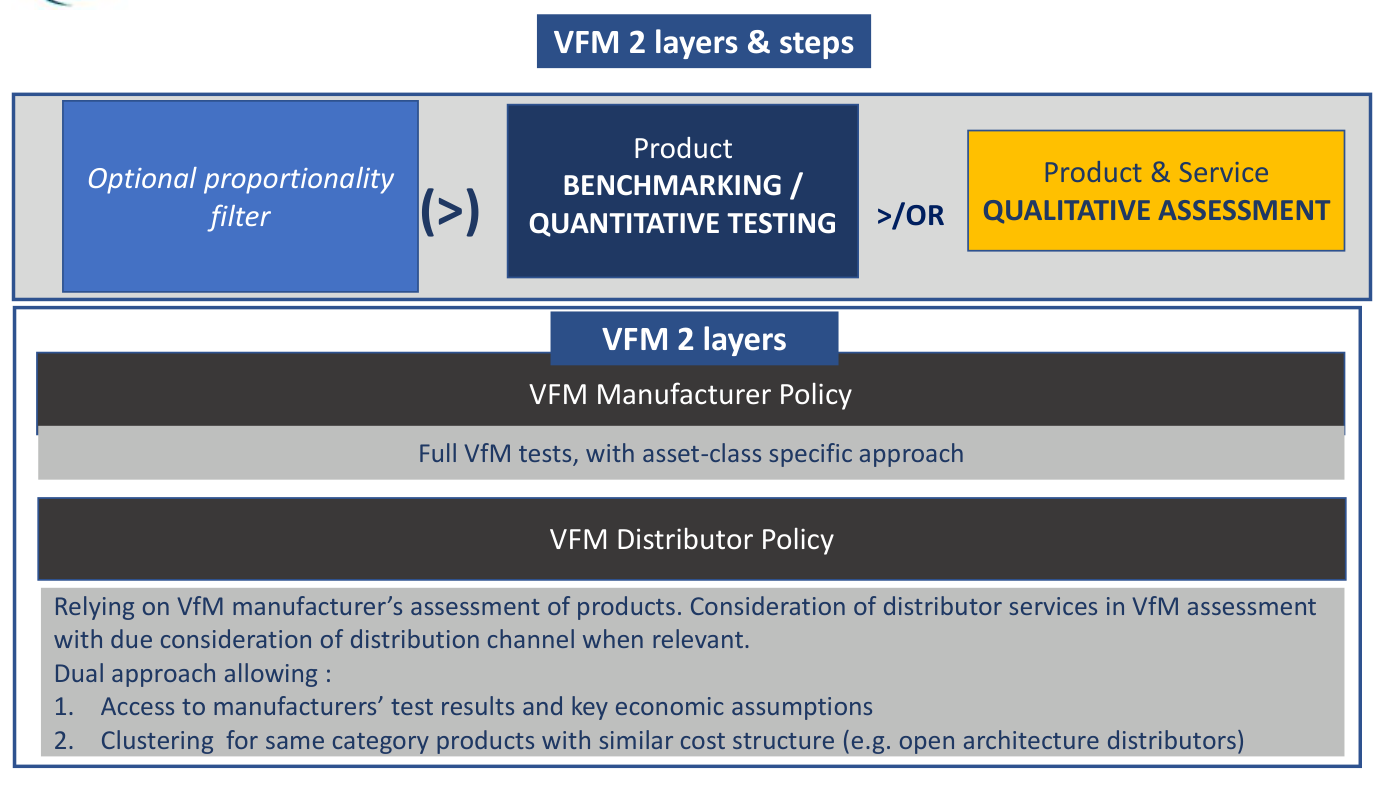
⇨ = VfM 2 layers
- On the Manufacturer layer: Performance and Qualitative assessment, combined with an optional proportionality filtering. VfM should rely on benchmarking to the next best alternative, in relation with the potential performance of the financial product, and a full appreciation of the benefits provided to the investors. It should be based on both quantitative and qualitative assessment of the product as well as services provided by the Manufacturer. It could be complemented with an optional proportionality filtering.
⇨ = VfM multi-steps approach: The multi-steps approach combines a probabilistic and a qualitative assessment to ensure that products launched bring value for end-investors. It could be complemented with an optional proportionality filtering whose purpose is to address operational issues and improve operational workload by leveraging on already available test results (e.g. through clustering) or identify clearcut cases (e.g. through a total Cost Grid filter).
- Relevant Scope. VfM should apply when relevant to a targeted scope e.g., PRIIPs perimeter with relevant exemptions or adaptations in accordance with point 1.c below.
- Asset-Class-specific approach. VfM should also be adapted according to asset classes and product types.
c. Products scope
VfM should apply to a targeted scope of financial products (the same as PRIIPs with relevant exemptions or adaptations) and it should be calibrated according to asset classes and product types.
For some financial instruments, VfM tests may not be conclusive3 at all or only in a generic or partial mode. Typically, for exchange traded securities, (“ETS”), due to very short-recommended holding periods of most products (often limited to 1 day), simulations are inapplicable and comparison with a benchmark is not relevant. Prices already directly reflect intrinsic product value of the option (in or out of the money).
Concerning ETS products, a future version of these Guidelines will detail recommendation as to perform a proportionated VfM assessment.
For Structured Notes/Products (“SPs”), VfM tests should take into account the asset class though, in particular for performance or qualitative assessment which would vary depending on the Equity or Rates nature of the exposure as well as specific features that product could provide.
This first release concerns products with Equity underlying that represent the majority of structured products sold to retail investors. Workshops are being conducted to propose an approach adapted to Fixed Income and Commodities products.
For now, in France, the priority product scope for VfM test are the SPs referenced in insurance wrappers subject to the ACPR 2023-R-01 but could then be relevant for SPs referenced in other wrappers.
| Structured products (EMTN) “SPs” | Full VfM (Quantitative & Qualitative) Asset-class-specific methodologies |
| ETS (e.g. warrants, turbos, and short-term options) | Proportionated VfM assessment |
2. VfM framework for Structured Products “SPs”
BOX 1 – Definition of structured products and the aim of the VFM
Structured products are debt instruments exposing the client to the issuer credit risk and they are therefore built using basic blocs with as a starting point a ‘deposit’ to the bank that issue the product that represents the Zero-Coupon Bond (“ZCB”). This bloc is at the root of the product design and conditions financial characteristics of the product.
This makes it particularly complicated to compare two structures issued by two different issuers solely based on financial characteristics (as coupon or protection of the capital) as it boils down to comparing two bonds issued by two different issuers without considering credit risk and markets appetite for each bond, both driving their price and therefore their yield.
To complete this ZCB and adapt its initial risk/return profile to client needs, a portfolio of financial options is added allowing to propose mechanisms as, for instance, conditional early redemption, conditional coupon, protection on the capital. A structured product can be seen as the association of a bank ZCB and a portfolio made of options and which constitutes the added value of the product.
The aim of the VFM should be to check whether the association of both the ZCB and the options has more value than the ZCB alone in the scenario corresponding to client’s implicit view, making the ZCB the most natural next best alternative.
The portfolio of options will be mainly composed of long positions on options (call options and/or digital options) for capital guaranteed products and be composed of both long positions (call options and/or digital options) and short positions (put options or put down & in options) for non-capital guaranteed products.
Long positions on options will contribute positively to the VFM test of both capital guaranteed and non-capital guaranteed products. Short positions on options which build the risk on capital will contribute negatively to the VFM test result for non-capital guaranteed products.
Therefore, the ZCB is the right benchmark both for capital guaranteed and non-capital guaranteed products as, other things being equal, the VFM test result will be systematically lower for non-capital guaranteed products.
Hedging and VfM – The option portfolio comprises some options that cannot be hedged using flow products available on the market (because of its maturity, its strike or its underlying) and can therefore be costly to hedge. This portfolio also often imposes dynamic adjustment of its composition during the life of the product and following market moves, exposing the issuer to the new market conditions while the formula for the investor remains the same.
That aspect of hedging makes profitability for the manufacturer uncertain and justifies that costs have not the same impact on the product value for structured products, compared to funds (see Box 2).
As explained in Objectives section above, VfM framework for Structured Products relies on the 2 layers of Product Governance: manufacturers and distributors cooperation (“VfM 2 layers”).
On Manufacturers layer, the framework would be based on a multi-step approach as described below (“multi-step funnel approach”).
3. Approach for VfM Manufacturers of Structured Products
The approach combines a probabilistic and a qualitative assessment to ensure that products launched bring value for end-investors.
BOX 2 – Different cost structures and pricing mechanisms between funds and structured products
Each asset class has a unique cost structure and pricing mechanisms that impact the overall cost to the investor. Applying a one-size-fits-all VfM rule would not accurately reflect these differences, potentially leading to non-level playing field comparisons and misleading conclusions.
Indeed, the notion of costs for structured products has two major differences with the costs of fund solutions.
First, the profitability for the manufacturer is uncertain and the figure displayed provides information on its expectation alone. It is not a guaranteed revenue for the manufacturer due to market risk that he has to hedge, unlike for funds where the asset manager cashes in the management fee (part of ongoing costs) with certainty irrespective of the fund’s performance.
Second, the entry cost displayed by the manufacturer in the KID or MIFID document, contains this expected profitability, and also includes hedging costs that relate to the design of the product.
As a result of the above, manufacturing costs may justify creating value for the end investors as opposed to fees charged for services provided. For example, the same product written on an ESG version of an index will cost more to hedge (no ESG option market) and have higher manufacturing costs. However, the presence of ESG selection criteria in the index is of value to the end customer with sustainability preferences.
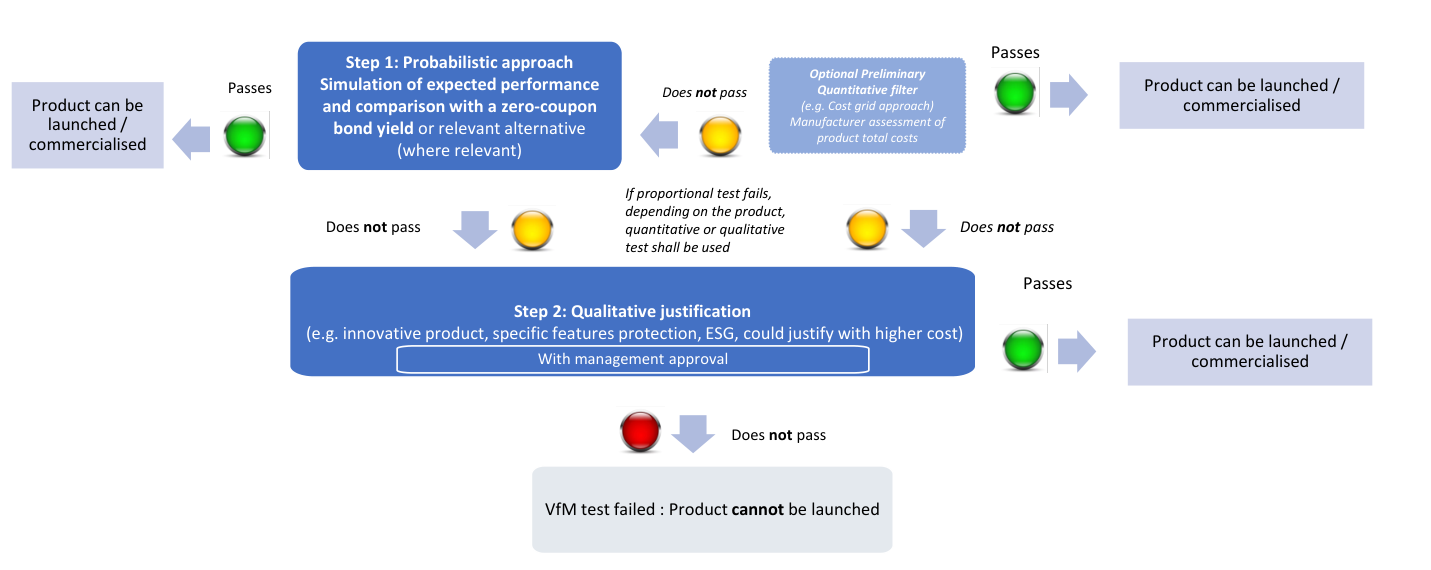
Step 1: Product benchmarking / Quantitative testing => Probabilistic approach
- The Manufacturer simulates expected performance of the product under certain assumptions (see a, Box 4), and compares it with a next best alternative, in compliance with principles detailed below (see a).
- If the product does pass the probabilistic test, it passes the VfM test and can be commercialized.
- If the product does not pass, it will be assessed through step 2 (“Qualitative justification”).
Step 2: Qualitative assessment of product features & management overseeing => Qualitative justification
- Manufacturers assess whether qualitative features and benefits of the product justifies the potential future performance level as measured in step 1, in compliance with principles detailed below (see b)).
- Notably, this step would require management overseeing, plus an independent control function with Product Governance supervision.
Optional proportionality filtering
The proportional filtering is used as an optional preliminary step, to address operational issues and improve efficiency by leveraging on already available test results (e.g. through clustering) or identify clearcut cases (e.g. through a total Cost Grid filter) (see point c).
The VfM framework should:
- Be documented, through internal policy and procedures on which appropriate training should be performed to relevant staff, and
- All tests should be subjected to appropriate record keeping and kept available, at request, to independent internal control function as well as supervisors/NCAs.
a. Step 1: Probabilistic benchmarking testing of performance against next best alternative
Probabilistic benchmarking aims at undertaking simulations to understand expected returns from the investor’s point of view. The manufacturer should consider what a reasonable comparison is for the “next best use of the investors’ money”.
Any economic assumptions made to run simulations must be reasonable, based on publicly available data (where possible), and should not result in a misleadingly favorable impression of potential returns.
Each product should be assessed individually against a hypothetical investment in a “next best alternative” also called “benchmarking product”, which is a simpler product which returns, features, and objectives can be compared to the actual SP being tested.
The objective is to identify if the actual product (inclusive of all product costs) is likely to perform in a range of market conditions, and, its returns compared to the next best alternative.
BOX 3 – The next-best alternative comparison, relevant for capital protected and non- capital protected products
In both capital-protected and non-capital protected products, the comparison with a zero-coupon bond from the same issuer ensures internal consistency in terms of funding cost and credit risk.
As mentioned in the Box 1, a structured product is built as a deposit and a portfolio of financial options in both capital-protected and non-capital protected solutions. Portfolios of options will differ from one another for capital-protected and non-capital protected solutions and contribute differently to VFM results. Short positions on options building the risk on capital will contribute negatively to the VFM test result for non-capital guaranteed products.
The aim of the VfM should be to check whether the association of both the ZCB and the options (either bought to pay coupon or indexation or sold to add risk on the capital) has more value than the ZCB alone in the scenario corresponding to the client’s implicit view, making the deposit the most natural next best alternative.
This comparison can be considered “benchmark-like” because it offers a consistent standard to evaluate how much extra cost the structured product charges for additional features (e.g., market exposure or optionality) versus a simple ZCB.
Next best alternative for Equity linked SPs
For equity linked products, that are not Delta-1, the next best alternative is a Zero-Coupon Bond (“ZCB”), issued by the manufacturer and of the same maturity as the product.
The Zero coupon is a recommended choice of next best alternative for several reasons:
- Investors in SPs generally seek to generate returns higher than the ones they can get in conventional short-term deposit, and for this they need to select a product tenor. Comparing the SP to a ZCB allows to compare products of the same tenor.
- The ZCB carries the same issuer credit risk than the structured product, meaning the test is free of any bias created by credit spreads being different between the SP and its benchmark.
Criteria to pass the test
A product is deemed to have passed this step of VfM test if the expected average annualised Internal Rate of Return (IRR) of the product exceeds the average IRR of the next best alternative in the scenario corresponding to the type of product (three categories of products bull/bear and neutral products).
BOX 4 – How is the scenario built in the VfM test?
The VfM test is using a scenario corresponding to the client’s implicit view when he decides to invest in a structured product. We define three categories of products:
- products that beneficiate from a market positive performance: Bull products,
- products that beneficiate from a market negative performance: Bear products,
- products that beneficiate from a rangy market: Neutral products.
The VfM will compute the IRR of the product using simulations where the equity risk premia beneficiate in average to the type of product the client chose to invest in.
For a structured product that beneficiates from a market positive performance, the scenario used to compute the IRR is computed using simulations that grow in average by the estimated equity risk premia.
The below Guidelines on IRR calculations, including parameters to be retained and scenarios simulations, are recommended4, with the aim of making comparisons between different alternatives easier.
Simulations to calculate the product’s IRR
Manufacturers are recommended to use a Black-scholes model to simulate the underlying using5 the following parameters:
Volatility: Average realised volatility 5 years (with a minimum of 2 years for underlyings having daily observed prices, if needed same extrapolation mechanism as used in PRIIPS can be used). This would bring consistency with the volatility parameter used in PRIIPs KID’s negative, moderate, and favourable scenario. This measure is publicly available and easily observable.
Correlation: Average realised correlation 5 years (with a minimum of 2 years for daily observed underlying, if needed same extrapolation mechanism as used in PRIIPS can be used) in consistency with correlation parameter used in PRIIPs KID’s scenarios.
Interest rate (curve): Mid swap curves used by the manufacturer or alternatively available from Bloomberg function IRSS.
Dividend: the yield corresponding to the market yield used from the official valuation model of the manufacturer.
Repo Rate: the yield corresponding to the market repo used from the valuation model of the manufacturer. If no repo market exists on the index / stocks, the repo rate should be 0%.
Decrement: Should the construction of the underlying performance involve a decrement mechanism, the corresponding amount will be deducted from the scenario simulations of the underlying in accordance with the relevant applicable decrement methodology (in percentage or in index points).
Scenario Trend of the underlying: depending on the scenario implicitly played by the client when investing in the product, taking consistently into consideration an Equity Risk Premia (ERP), as for examples provided below.
For instance,
- Scenario used for Bull products: Trend = Interest Rate – Dividends (for Price Return underlying without decrement) – Repo – Decrement (for Price Return underlying with decrement) + ERP*
- Scenario used for Neutral products: Trend = Interest Rate – Dividends (for Price Return underlying without decrement) – Repo – Decrement (for Price Return underlying with decrement) + 0%
- Scenario used for Bear products: Trend = Interest Rate – Dividends (for Price Return underlying without decrement) – Repo – Decrement (for Price Return underlying with decrement) – ERP*
*Where the ERP could be computed as ERP = Sharpe Ratio x Volatility, with a Sharpe ratio expected between 0.4 and 0.5.
The ERP represents expected growth of the underlying above the risk-free rate. For instance, equities carry an ERP which often is proportional to the level of risk that they carry (i.e. volatility).
At least 10 000 simulations are recommended in each of the 3 scenarios.
Product IRR calculation
The internal rate of return of the product (“IRR_product”) is calculated as the average over the individual simulations IRR (), assuming the product is bought at its issue price (inclusive of all costs)
Proposition 1
is the solution of the following equation
is the cash flow (either coupon,capital…) paid on path i at date t, and is the corresponding tenor expressed in years from the issue date.
Proposition 2
is a discount rate that makes the net present value (NPV) of all cash flows equal to zero (including the Product Purchase Price)
From a minimum of 10 000 simulations, we can obtain a distribution of IRRs of the product. The IRR product is a statistic indicator built using the above distribution indicator reflecting the product potential. Where relevant, additional indicators could be added, such as, a risk factor.
The product average IRR must exceed the average IRR of the next best alternative in the scenario implicitly played by the client as defined above.
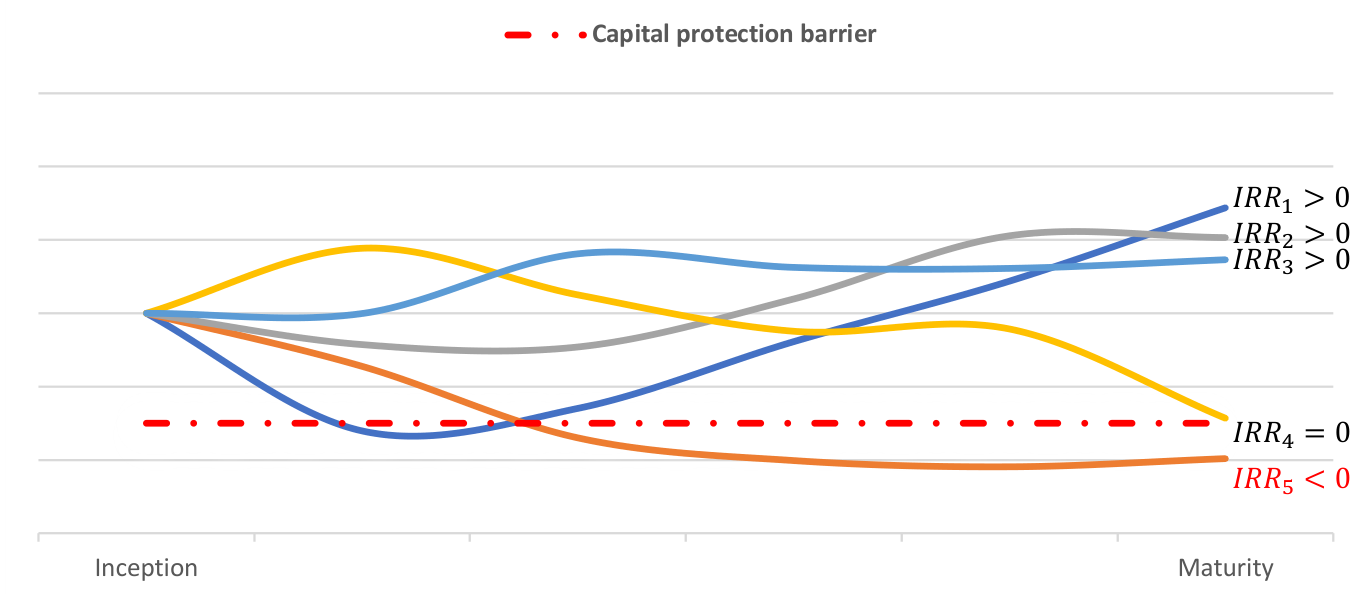
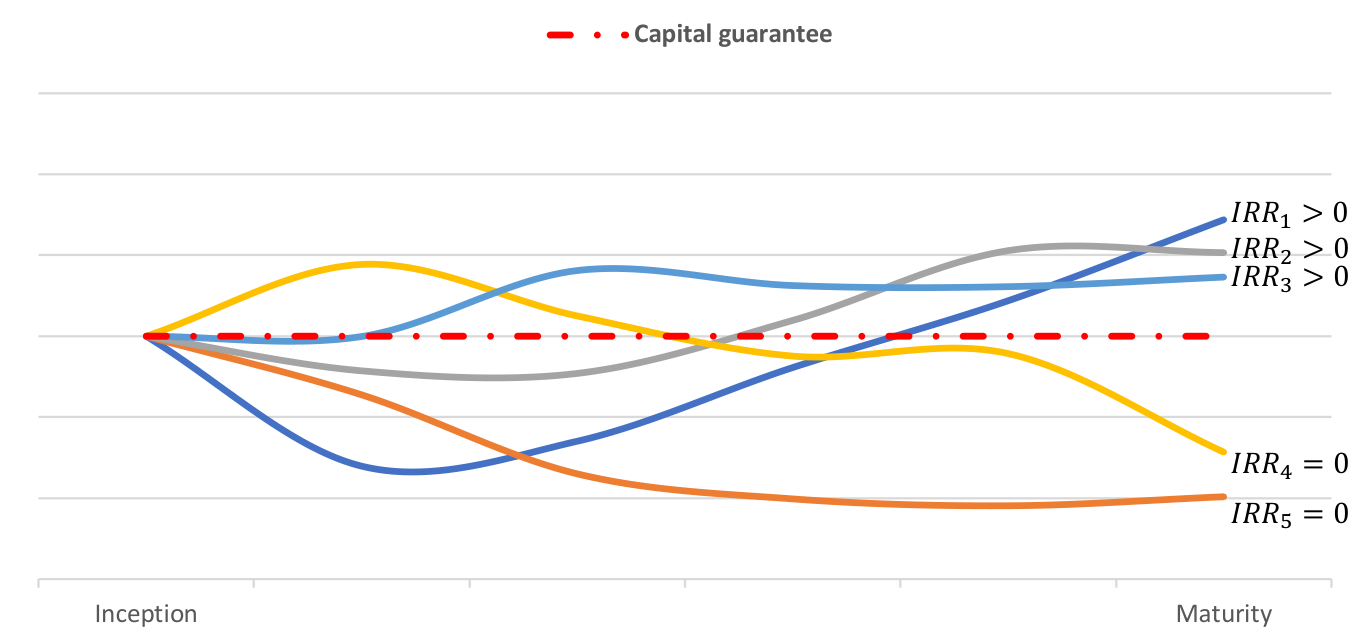
The graphs below illustrate the principles mentioned in the Box 1 and 3. Indeed, the product VfM test result will be systematically lower for non-capital guaranteed product, as described in the first graph, compared to the second graph (see the ).
Next best alternative IRR calculation
The internal rate of return (IRR) of next best alternative (“IRR_nba”) is calculated as the average over the individual simulations IRR () as follows:
* Where: ZC Purchase Price(i) is the purchase price of the ZCB with tenor equal to Tenor(i) and valued using the Interest rate curve above and including the internal funding spread of the manufacturer.
Tenor(i) is the tenor of the last cash flow paid on path i in the Product IRR calculation
Conclusion
As explained above, a product is deemed to have passed this step of VfM test if the average IRR of the product exceeds the average IRR of the next best alternative obtained, in the scenario corresponding to the product.
Therefore, this step resumes as follow:
- If it does, the product passes the VfM test and can be commercialised.
- If it does not, it must be assessed through qualitative assessment.
b. Step 2: Additional qualitative assessment of the product
Step 2 of VfM consists in a qualitative assessment of the product features overseen by an appropriate governance including management approval.
Manufacturers should assess whether qualitative features and benefits of the product justifies its potential future performance level compared to its next best alternative. Notably, this step supposes governance requiring management overseeing and independently monitored by a control function, as a second line of defense.
Product Qualitative Assessment
Such assessment can be based notably and not exhaustively on the following criteria:
- Capital protection mechanism, in full or in part,
- Product liquidity features, such as guaranteed daily liquidity, other liquidity provisions,
- Early-exit conditions,
- ESG features and/or the compliance with EU or national guidelines
- Exposure to specific assets, not easily accessible and corresponding to the investor’s objectives,
- Any other specific product characteristics.
Such validation should be obtained within an appropriate governance, including management approvals and detailed, thorough, and relevant justifications.
Where relevant, it can also include an assessment of services provided by the Manufacturer.
c. Optional proportionality filtering
The purpose of the proportionality filtering is to manage operational workload arising from individual product testing on important volumes. A proportionality filter should be calibrated so that it only filters products with a high level of comfort in passing the Probabilistic Approach leveraging on already available Probabilistic Approach results on similar products.
As an example, for an optional proportionality filtering, product clustering (e.g. by type of product, maturity among recent issuances) associated with a costs grid filter could be defined and applied by the Manufacturer if and where relevant, considering the nature and volume of the products issued. Other proportionality filtering might be applied by Manufacturer, where relevant, considering the nature and volume of products at stake (e.g., very simple pay-off /mainstreams products).
The rationale for this step is that even though costs are not a relevant standalone criterion for assessing products value, provided that is well calibrated (see above) this preliminary filtering could be implemented by Manufacturers for having a proportionate VfM approach and focusing on the most relevant products.
A filter based on cost grids and clusters cannot be calibrated as an average of peers, rather each manufacturer is responsible for calibrating its own grid and the granularity of its clusters.
Grid costs filter shall comply with the following principles:
- Total Costs Annualized (“TCA”): The product Total Cost Annualized combines manufacturing costs of the product and distribution fees embedded in the product, both entry cost and ongoing costs. The sum of all entry cost is then annualized by the product tenor, to which is added the ongoing cost to obtain “total cost annualized”.where:
- Efficient filter. The TCA of the product should be below a relevant grid level to pass the proportionality filter. The grid level should be adequately calibrated so that (i) a majority of product of the manufacturer remains tested with forward looking probabilistic tests, and that (ii) Products that would pass this filter should offer sufficient comfort for VfM purposes.
- Granularity. It should be calibrated in a sufficient granular way (i.e., more granular than MiFID internal margin policies8) to capture range of products features to consider performance/value of all products and pay-offs. For instance, the cost filter grid could have several parameters like buckets of maturity, and currency (G10 versus emerging market currency).
- Monitoring and review. The grid levels should be monitored to assess its relevancy and revised regularly involving the compliance department (or any other independent control function) and articulating it with the product governance of the manufacturer. For instance, taking into account market evolutions (including evolution of interest rates) and material events. The granularity of grids should also be reviewed regularly based on changes in the products (tenors, currencies…).
- Made available to NCAs. For manufacturers using this preliminary cost filter, it shall be made available to supervisors on request and not be published on a publicly available website or communicated to competitors, to comply with competition law.
d. Assessment of Manufacturer’s services
Financial products cannot be separated from the services that permit this access, including the manufacturer’s services when complement those of distributors (e.g., product information hotline or other expertise made available to end-investors).
This value-assessment regarding manufacturers’ services may also concern the product’s secondary market.
For instance, a listing on an exchange would not qualify as a value-adding service since this is often a regulatory requirement or a basic commercial need of investors. However, cases when manufacturers play a direct role in secondary market (e.g., banks acting as intra-day liquidity provider for structured products) and provide a specific contribution that clearly exceeds the service quality of peer solutions (e.g., integrated electronic execution platform embedding other useful applications), could be deemed as value-adding Manufacturer’s services.
***
Final Assessment considering all steps
- If the product is considered as providing enough qualitative value, that in any case, shall be justified in relation to the total costs, the product passes the VfM test and can be commercialized.
- If the product is not considered as providing qualitative value or not justified to its level of costs, the product will fail the VfM test and will not be commercialized.
***
4. Transparency and disclosures of VfM
VfM framework should:
- Be documented, through internal policy and procedures on which appropriate training should be performed to relevant staff,
- All tests should be subjected to appropriate record keeping and kept available, at request, to independent internal control function as well as supervisors/NCAs.
Indeed, close liaison with relevant NCAs is necessary to ensure they will be able to exercise their supervision missions efficiently. All information about the methodology, its implementation and value for money tests performed accordingly will be formalized, record kept and made available to NCAs, here again, so they can closely monitor the efficiency of the framework.
a. Transparency towards supervisors
Manufacturers should keep available for a period of 5 years and provide at request of supervisors:
- All normative documentation supporting VfM framework,
- Content of costs grid filters and methodologies used to design those,
- Principles, parameters, and calculation methodologies for the probabilistic approach,
- Results of VfM tests for all relevant products, and
- Any other relevant information or document.
b. Disclosures towards distributors
Like explained in section 1., a VfM framework relies on 2 layers approaches where the VfM performed by Distributors can rely on the VfM performed by Manufacturers.
Therefore, Manufacturers could share with their distributors the following elements to that aim:
(i) As general information
- Summary of methodologies principles retained by the Manufacturer, and/or
- a statement that the firm complies with the present general Guidelines and/or a public summary of the detailed present Guidelines prepared by AFPDB and made available on its website.
(ii) At a product level
- Where VfM test passed, a confirmation that the product passed the VfM test (e.g., via filling in corresponding fields in EMT),
c. The VfM test performed by distributors and articulation between manufacturers and distributors VfM assessment
BOX 5 – How to articulate the “VfM manufacturer” and the “VfM distributor”?
Within the current Product Governance MiFID II set-up, both manufacturers and distributors must define the target market of the products they intend to market.
VfM is an integral part of MiFID II Product Governance framework and as such involves a necessary cooperation between manufacturers and distributors while avoiding unnecessary duplication.
Practically speaking, manufacturers use standard documents (e.g., EMT) to share the relevant target market information to distributors they define, in a standardized way. Then, distributors must decide whether (i) the distributor target market is similar or (ii) different from the manufacturer target market.
A same process should be applied when the manufacturer should disclose its VfM results of the product towards distributors/insurers for them to rely on those and avoid duplication.
Manufacturers should provide to distributors all relevant information they need, for them to rely on the manufacturers’ assessment of VfM.
Distributors shall have access to manufacturers tests results, as well as key economic assumptions (e.g., summary of methodologies and principles retained by the Manufacturer) and, at product level, where the VfM test has been passed, a confirmation that the product passed the VfM test (e.g., with a field Yes/No to be included in EMT for instance).
In that respect, Distributors could rely on manufacturers VfM assessment of the products costs, including distribution fees (or inducement).
However, Distributors should make their own VfM analysis to consider other distribution costs, including execution or, where applicable, investment advice that manufacturers do not necessarily know at the step of the product’s manufacturing. This should also include giving due consideration of distribution channel, where relevant.
It should be the same approach for insurers’ products: insurers can rely on manufacturers VfM assessment of the product as wrapped in an insurance policy, including fees paid to the insurer for registering the product when relevant, based on VfM test results disclosed to them. They should however assess their own services, including their own insurance annual fees when such fees are outside the control of the manufacturer (for instance life insurance annual contract fees taken outside the structured product on the basis of the total value of asset, including other assets like funds, bonds, or shares within the insurance contract).
This set up provides a complete assessment of the VfM – both quantitative and qualitative – on both the product and related services provided to the retail end-investors.
===
Annex I
RIS OBJECTIVES “adequate protection, bias-free advice, open markets and transparent, comparable and understandable product information
Notes
- EU strategy for retail investors, 2021 EU Commission consultation. ↩
- ACPR 2023-R-01 point 4.1.1.18 « Réaliser des tests pour s’assurer que les coûts du produit sont proportionnés aux bénéfices attendus pour le marché cible identifié. Ces tests comprennent notamment des évaluations et des comparaisons à l’échelle du marché de la performance, des coûts et des risques des supports d’investissement commercialisés ». ↩
- That’s the case for hedging solutions (e.g., FX/Rates derivatives) as well as ordinary shares and vanilla bonds but that are out of scope of this Guidance. ↩
- However, members are free to decide when a specific product requires the use of different testing inputs or models as may be the case from time to time. ↩
- Similarly, such references parameters are recommended to ensure as much as homogeneity of practices among members but cannot be considered as mandatory nor prescriptive requirements. ↩
- EMT field 07020. ↩
- EMT field 07100. ↩
- Implemented for best execution purposes (Art. 27 of MiFID II & Art. 64(4) of the MiFID II Delegated Regulation). ↩
Authoritative PDF version: Value for Money for Structured Products – AFPDB Best Practices Guidelines, 31 July 2025 (PDF).